In this blog, I will thoroughly explain my initial DevSecOps Pipeline Plan and how I would orchestrate all of these tools to build an automation machine for enterprise-level deployments.
Company GitHub
I’ve created a mock virtual company in the name of Paragon Corp to simulate a real GitHub account and repository structure for corporations. While the existing repositories and codebase are currently placeholders, I’m planning to build a microservice-based application using Go in the future.
This GitHub account will also serve as the central repository for all my Infrastructure as Code (IaC) assets, including Terraform modules, Open Policy Agent (OPA) policies, and Kubernetes Manifests for future deployments.
CI/CD
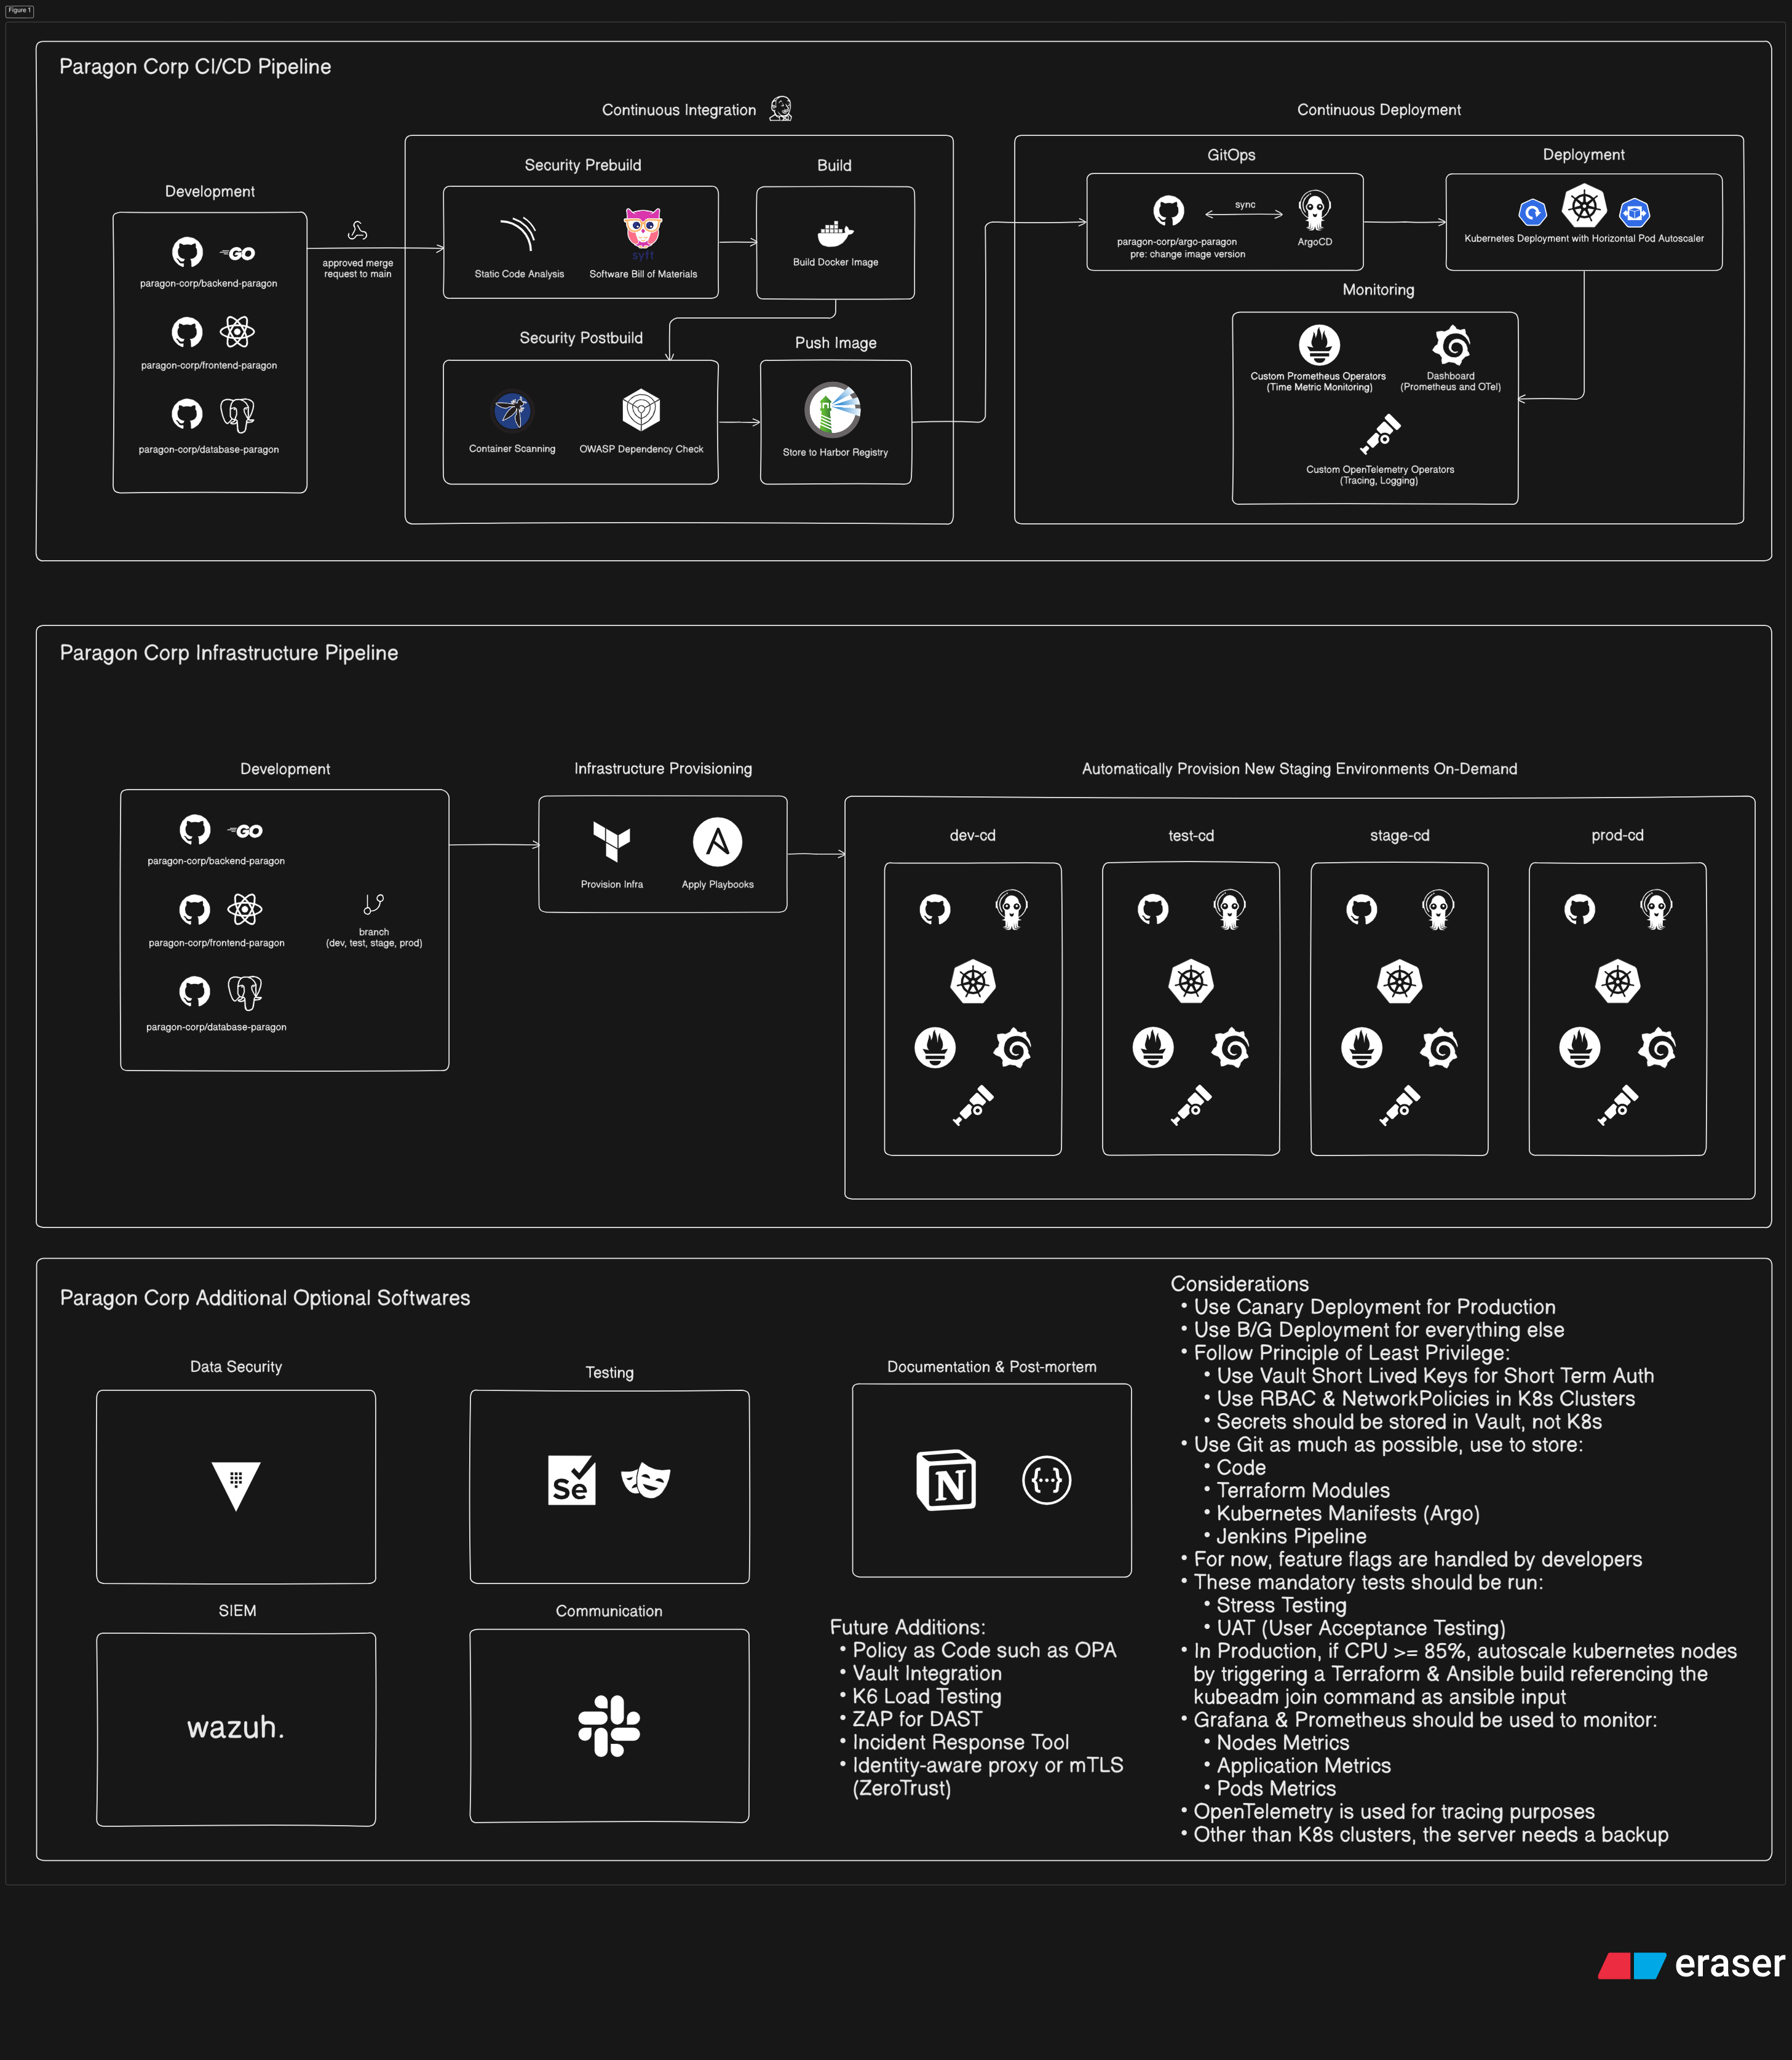
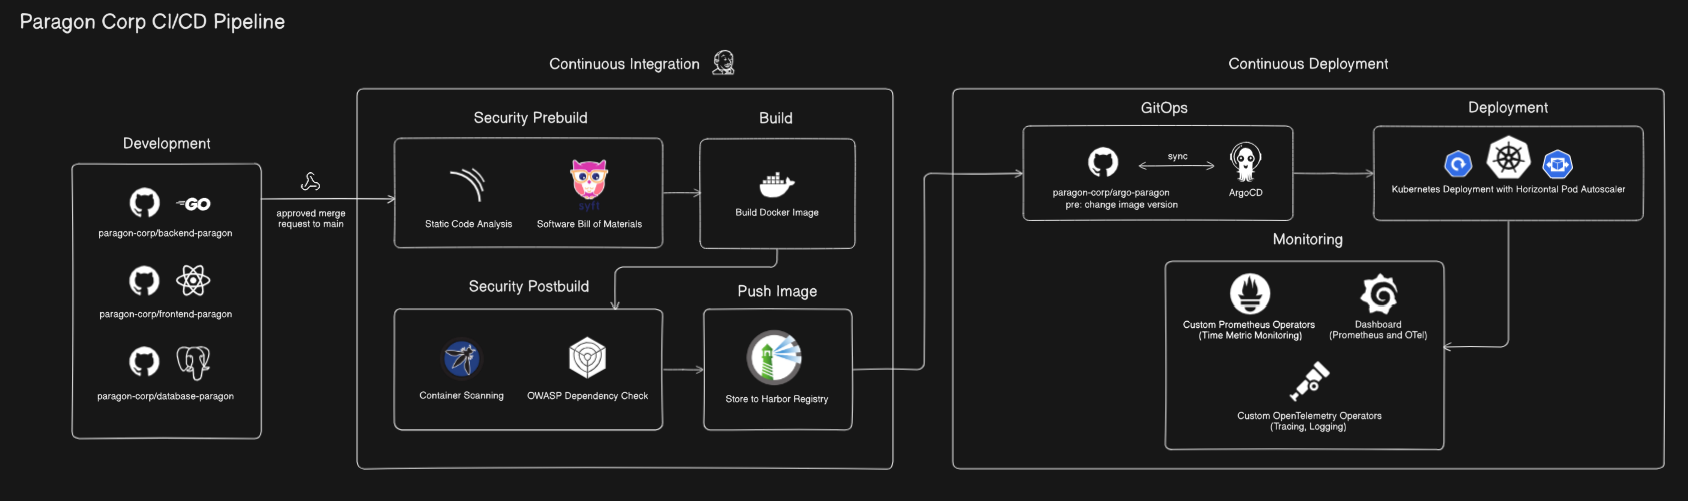
Our CI/CD pipeline is designed to automate the entire software delivery process, from code commit to production deployment, with security woven into every stage.
Continuous Integration
Development
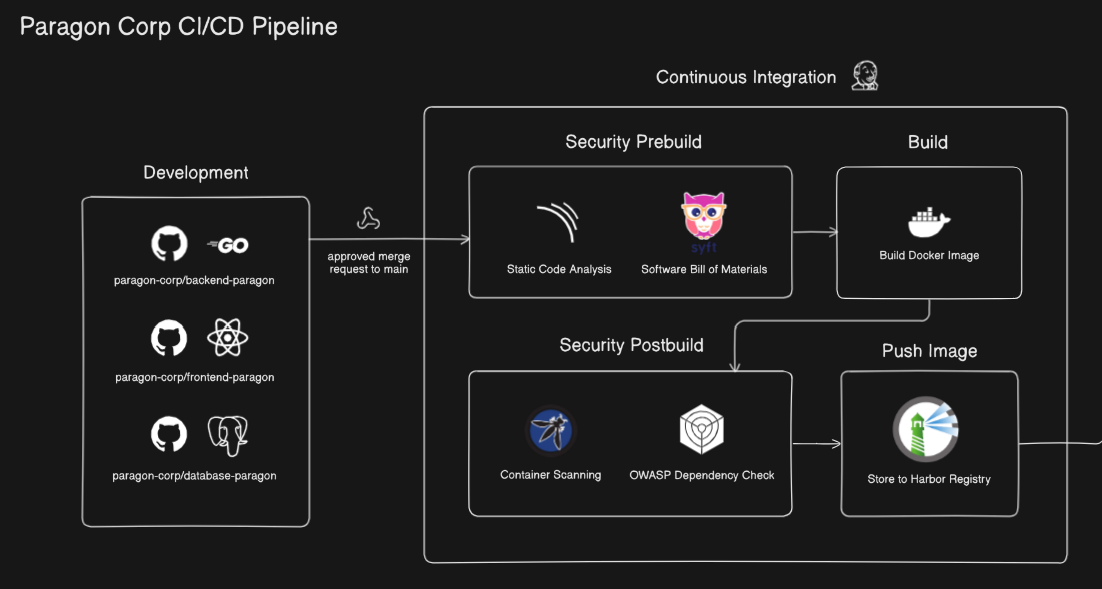
The development phase begins with developers creating three separate repositories within the paragon-corp organization:
paragon-corp/backend-paragon(Go): For our backend microservices.paragon-corp/frontend-paragon(React): For our user-facing applications.paragon-corp/database-paragon(PostgreSQL): This repository is unique; it stores SQL files for schema creation and mock data insertion. Since we prioritize persistent data and separation of concerns, the database will be managed on a dedicated server by a database administrator, distinct from our application deployment process.
Every approved merge request to the paragon-corp/frontend-paragon or paragon-corp/backend-paragon repository will automatically trigger a webhook, initiating a CI pipeline run on one of our Jenkins worker nodes.
Security Prebuild
Our pipeline integrates security early (“shift-left”) in the CI process:
- Sonarqube: Utilized for SAST (Static Application Security Testing) to analyze source code for vulnerabilities and code quality issues before the build process.
- Syft: Automates the listing of our application’s SBOM (Software Bill of Materials), providing transparency into all included dependencies.
Build
This stage focuses on creating the deployable artifact:
- The Docker image is built using the
Dockerfilepresent in the respective Git repository.
Security Postbuild
After the build, another layer of security scanning is applied:
- OWASP Dependency Check: Identifies publicly disclosed CVEs (Common Vulnerabilities and Exposures) within our third-party application dependencies.
- Trivy: Scans the newly built container images for vulnerabilities, ensuring that the final artifact is as secure as possible.
Push Image
- Images that have successfully passed both the prebuild and postbuild security scans are pushed to our Harbor Registry Server. The current successful image is then tagged as
latestto ensure we always refer to the most recently validated version.
Continuous Deployment
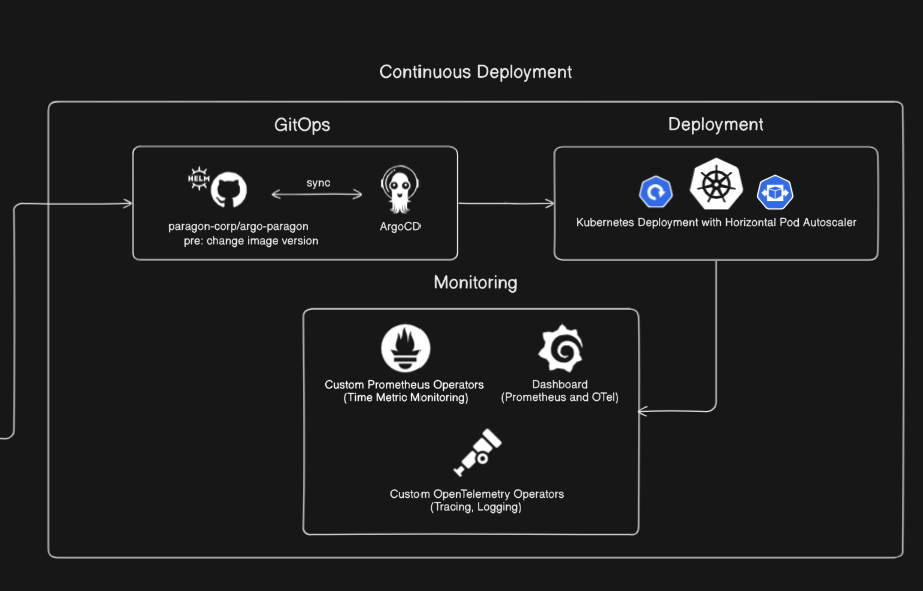
GitOps
Following a successful image push, a Jenkins node updates the relevant Helm Chart to reference the new image version in the registry. ArgoCD, our GitOps tool, detects this change in the Git repository (our desired state). It then automatically synchronizes the Kubernetes Cluster to match this desired state, rolling out a new set of pods with the updated images. Our rollback strategy will be detailed in future posts, but GitOps inherently simplifies rollbacks by simply reverting the Git commit.
Deployment
Deployment in Kubernetes is managed using the standard Deployment object. We leverage Horizontal Pod Autoscaler (HPA), which is configured to automatically scale up or down the number of pods based on defined criteria (e.g., CPU utilization, custom metrics). Horizontal autoscaling is highly encouraged as long as sufficient cluster resources are available, ensuring application responsiveness and efficiency.
Monitoring
Comprehensive observability is key to operational excellence:
- Custom Prometheus & OpenTelemetry Operators are deployed within the Kubernetes Cluster to automatically collect metrics, traces, and logs from our applications and infrastructure.
- Grafana is then used to visualize this rich data in intuitive dashboards, providing real-time insights into system health and performance.
Infrastructure Pipeline
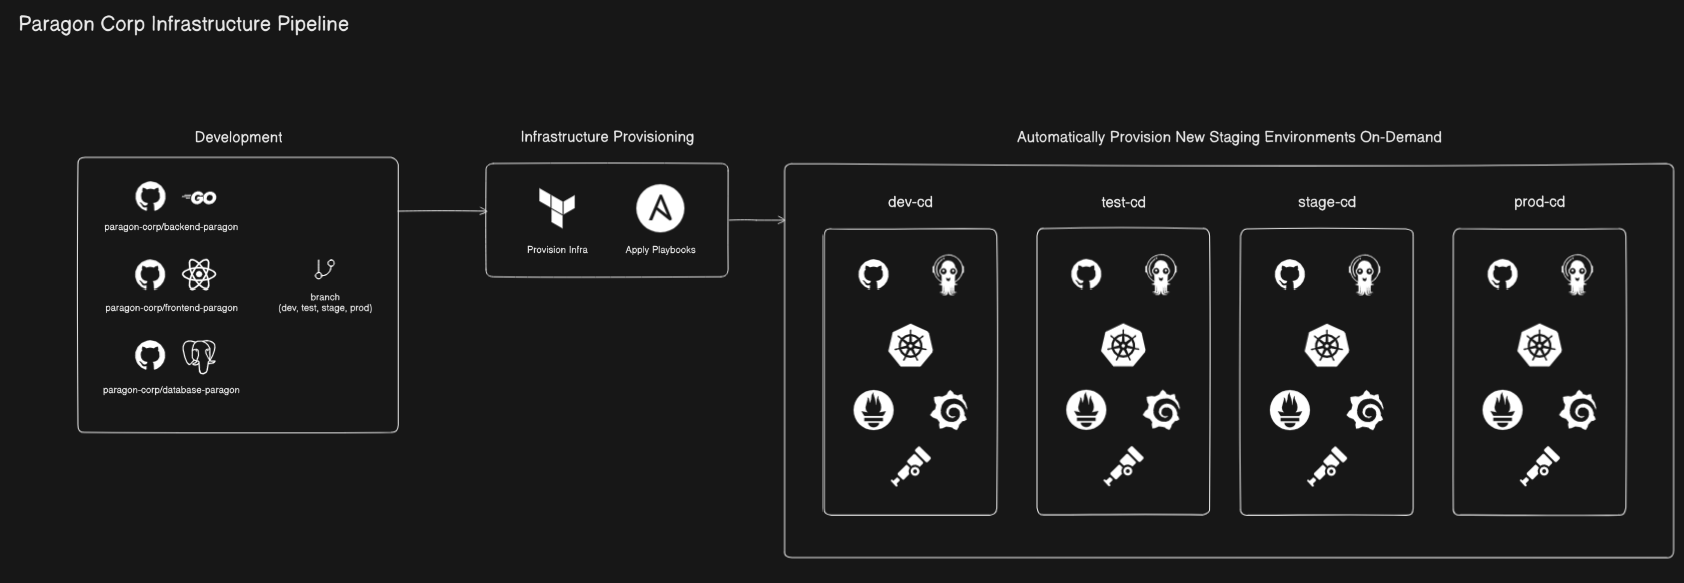
For our core infrastructure, most persistent tools, including Jenkins, SonarQube, Trivy, Syft, HashiCorp Vault, and Wazuh, will be hosted on dedicated Virtual Machines (VMs) with automated backup solutions to ensure their resilience and data integrity.
The Kubernetes Clusters, however, will be provisioned dynamically, aligning with our company’s evolving needs for development, testing, and production environments.
In the development section above, we outlined distinct branches (dev, test, stage, prod). We aim for maximum isolation between these stages, which necessitates instantiating separate Kubernetes clusters for each. This challenge of dynamic provisioning is elegantly solved using Terraform for Infrastructure as Code (IaC) and Ansible for post-provisioning bash automation (e.g., installing Kubernetes, joining nodes, and installing Calico CNI).
The workflow for dynamic cluster provisioning is as follows: If the VMs for a given stage (e.g., stage) do not yet exist, a Terraform template and Ansible playbook will be triggered to provision a brand-new cluster for that specific stage. The VM naming convention will be dynamically updated within the Terraform Module; for a stage cluster, this would result in hostnames like stage-master-1, stage-worker-1, and stage-worker-2. Furthermore, IP addresses will be pre-allocated and CIDR blocks reserved specifically for the cluster’s network purposes, ensuring a clean and isolated environment.
Additional Optional Softwares
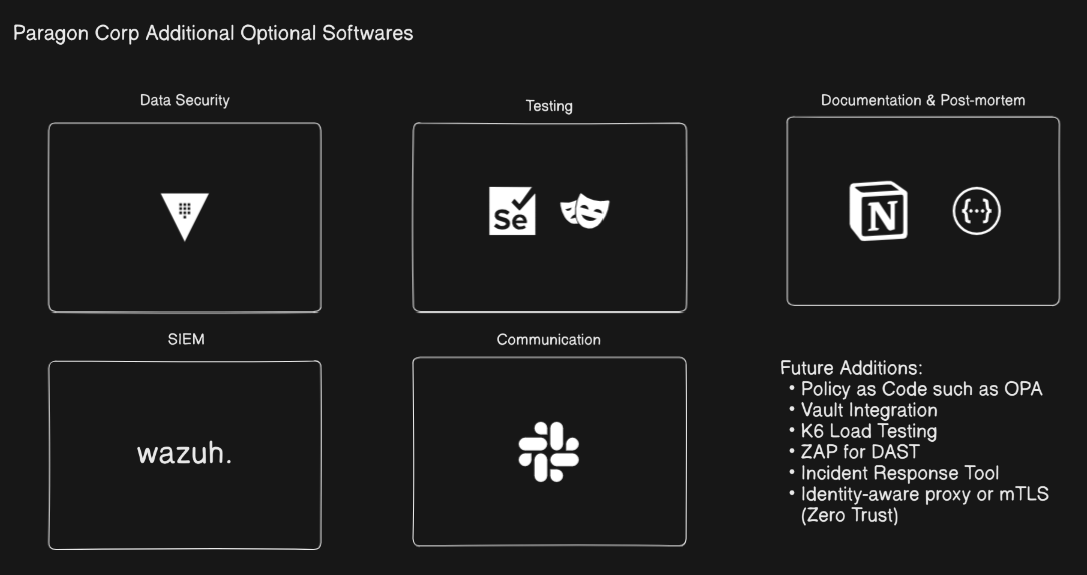
These tools represent additional layers of security, testing, and operational excellence that I will integrate into the pipeline in future iterations. For now, here’s a brief overview of their purpose:
Data Security
- Hashicorp Vault: Vault provides secure storage for both long-lived credentials (e.g., database passwords, API tokens) and dynamic secrets (e.g., short-lived cloud access keys). Its integration will:
- Prevent hardcoding secrets directly in pipelines or container images.
- Support dynamic secrets with automatic expiration, reducing the attack surface.
- Enable automated secret rotation for enhanced security.
Testing
- Selenium: Used for traditional browser-based UI automation testing. This is especially critical for validating full-stack user flows and ensuring the front-end behaves as expected.
- Playwright: An alternative or complementary tool for advanced End-to-End (E2E) and regression testing. Playwright offers modern features like parallelization, visual comparison, and network mocking, often proving more developer-friendly than Selenium in certain use cases.
Documentation & Post-mortem
- Notion: Serves as the central knowledge base for our team, documenting:
- CI/CD pipeline configurations and processes.
- Key architectural decisions.
- Incident post-mortems and lessons learned.
- Operational runbooks and Standard Operating Procedures (SOPs).
- Swagger: To automatically document the APIs created by our developers, ensuring clear and up-to-date API specifications for internal and external consumers.
- Post-mortem template tools (e.g., Incident.io style): To guide structured incident analysis and Root Cause Analysis (RCA) reporting, fostering a culture of continuous improvement from outages.
SIEM
- Wazuh: A crucial component for our security monitoring, providing:
- Centralized log analysis from operating systems, applications, and cloud environments.
- File Integrity Monitoring (FIM) to detect unauthorized changes to critical files.
- Intrusion detection capabilities.
- Agent-based alerts from Kubernetes nodes and critical infrastructure VMs for real-time threat detection.
Communication
- Slack: Our primary collaboration channel. It will be integrated with:
- Jenkins for immediate job status updates (build pass/fail).
- Wazuh for critical security alerts.
- Incident escalation and post-mortem workflows to facilitate rapid response and communication during outages.
Considerations
Our pipeline design incorporates several key operational and architectural considerations:
- Canary Deployment for Production: To reduce the risk of new deployments, rolling out changes to a small subset of users first.
- Blue/Green Deployment for everything else: For seamless, zero-downtime deployments in non-production environments.
- Follow Principle of Least Privilege:
- Use Vault Short-Lived Keys for temporary authentication tokens.
- Implement strict RBAC (Role-Based Access Control) and Network Policies within Kubernetes Clusters to limit access and control traffic flow.
- All secrets must be stored in Vault, never hardcoded in code or configuration files.
- Use Git as much as possible: For versioning and managing:
- Application code.
- Terraform Modules (Infrastructure as Code).
- Kubernetes Manifests (managed by ArgoCD).
- Jenkins Pipelines definitions.
- Feature Flags: For now, feature flags are handled directly by developers, allowing for dynamic feature rollout and A/B testing.
- Mandatory Tests: These essential tests must be run for every deployment:
- Stress Testing (to assess performance under heavy load).
- UAT (User Acceptance Testing) (to ensure user requirements are met).
- Kubernetes Node Autoscaling: In Production, if CPU utilization consistently exceeds 85%, Kubernetes nodes will automatically autoscale by triggering a Terraform & Ansible build. This build will reference the
kubeadm joincommand as Ansible input, adding new nodes to the cluster dynamically. - Comprehensive Monitoring with Grafana & Prometheus: Used to monitor:
- Pods Metrics
- Nodes Metrics
- Application Metrics
- Server Backup: All servers hosting persistent tools (other than dynamic K8s clusters) require a robust backup strategy for disaster recovery.
Full CI/CD + Infra + Additional Tools Figure